
While health insurance can prevent emergencies and catastrophic conditions from decimating your financial plans, the premiums and out-of-pocket expenses can also take a toll on your wallet. In 2024, the average annual premium for a single individual was nearly $9,000—and an estimated $25,500 for a family of four. While many workplaces subsidize these premiums, and the Affordable Care Act opened access to health care for Americans not covered by employer plans, health insurance is still often a costly budget item that some individuals may forgo. In these cases, Americans may be making tradeoffs between their health and their financial well-being.
With this in mind, SmartAsset ranked 810 U.S. counties based on the rate of people under age 65 who were insured in 2024. Annual changes in coverage, coverage of children, and the relative presence of primary care physicians in each county are also examined.
Key Findings
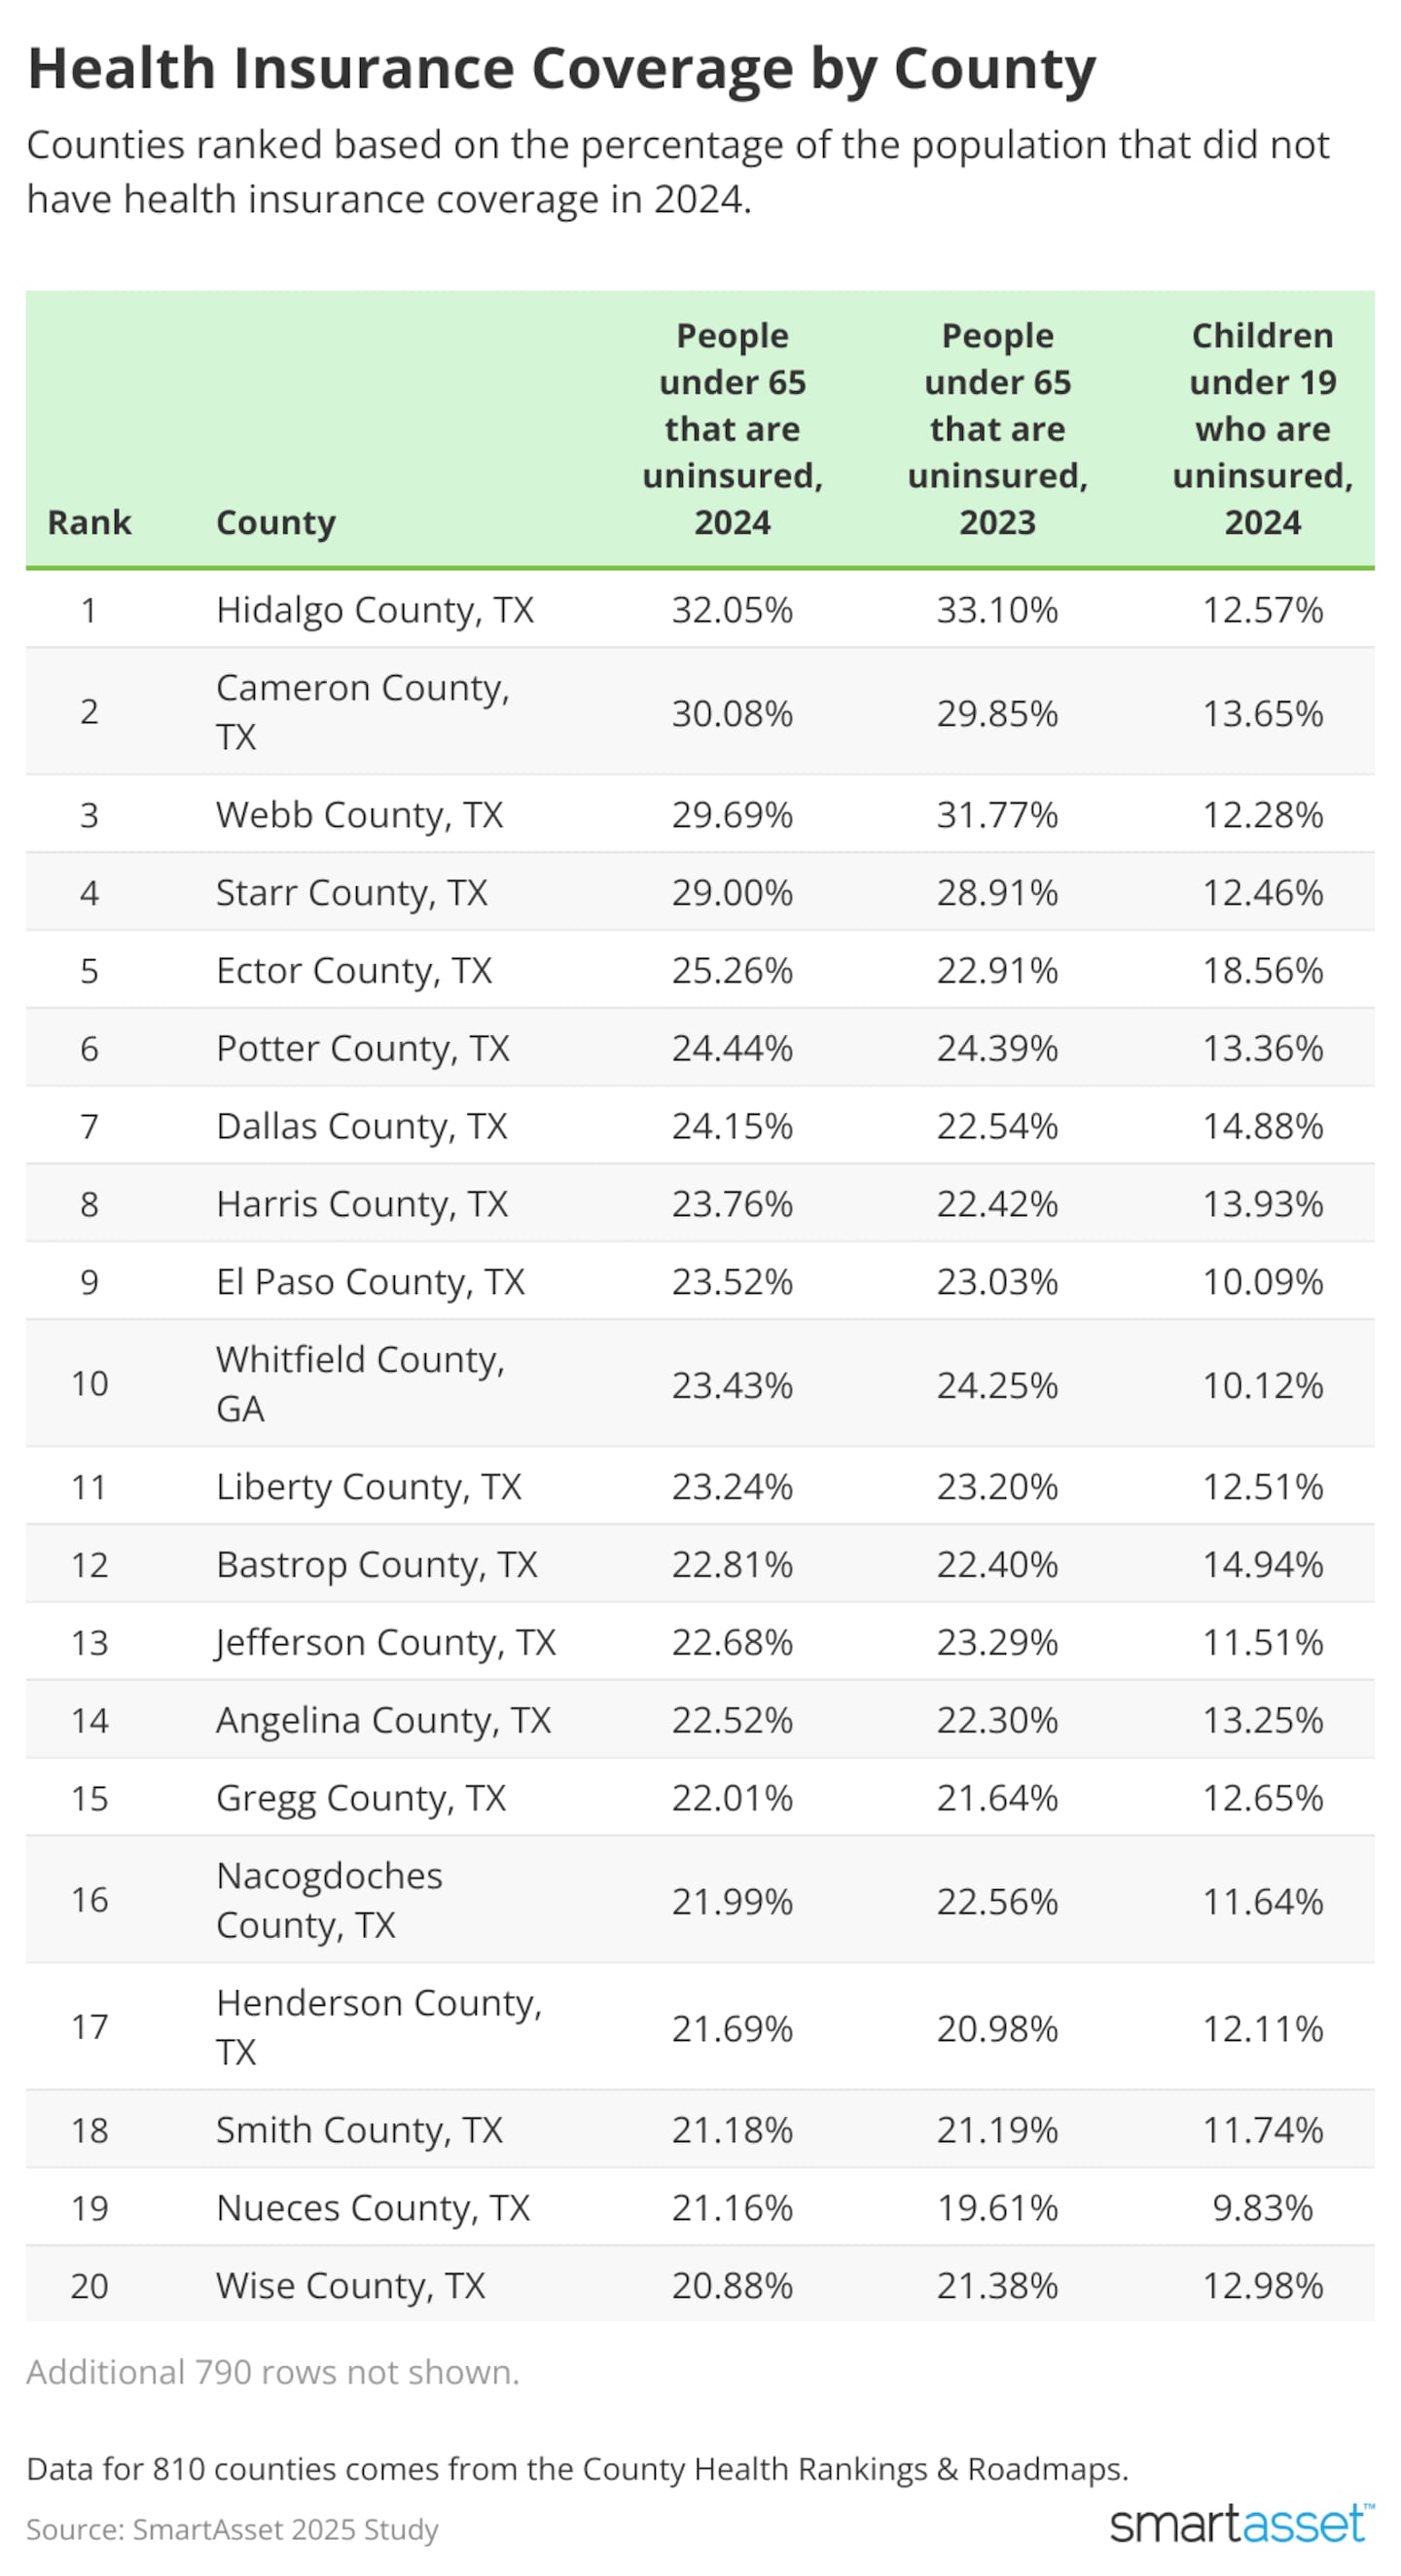
- These Texas counties have the lowest rates of health insurance coverage nationwide. More than any other county, 32% of residents in Hidalgo County don't have health insurance. Cameron County (30.1% uninsured), Webb County (29.7%), Starr County (29%), Ector County (25.3%), Potter County (24.4%), Dallas County (24.2%), Harris County (23.8%), and El Paso County (23.5%) are also among the top 10 uninsured counties nationwide.
- More than 96% of the population has health insurance in this state. Massachusetts dominates the rankings for high rates of health insurance coverage. Norfolk County has the highest rate of insurance at 97.6%. Statewide, more than 98.5% of children under age 19 have health insurance.
- These counties have the highest and lowest rates of primary care physicians. Orange County, TX, ranking 84th overall for lowest rate of health insurance among the population, has 6,053 residents per primary care physician – more than any other county studywide. On the other hand, 18th place Smith County, TX has the smallest number of residents per primary care physician studywide at 1,014.
- The biggest swings in coverage year over year happened in these counties. Relative to the population, Tom Green County, TX (25th highest rank of uninsured residents) saw the biggest drop in insurance coverage, going from 17.5% uninsured in 2023 to 20.2% uninsured in 2024. Meanwhile, Elkhart County, IN saw the biggest relative improvement in insurance coverage, going from 16.6% uninsured in 2023 to 13.3% uninsured in 2024.
SmartAsset
Top 20 Counties With the Highest Rates of Uninsured People
Counties are ranked based on the rate of total population under age 65 that did not have health insurance in 2024.
- Hidalgo County, TX
- People under 65 that are uninsured, 2024: 32.05%
- People under 65 that are uninsured, 2023: 33.10%
- Population per primary care physician: 2,158
- Population per mental health care professional: 1,199
- Children under 19 who are uninsured, 2024: 12.57%
- Cameron County, TX
- People under 65 that are uninsured, 2024: 30.08%
- People under 65 that are uninsured, 2023: 29.85%
- Population per primary care physician: 2,034
- Population per mental health care professional: 1,128
- Children under 19 who are uninsured, 2024: 13.65%
- Webb County, TX
- People under 65 that are uninsured, 2024: 29.69%
- People under 65 that are uninsured, 2023: 31.77%
- Population per primary care physician: 3,268
- Population per mental health care professional: 1,913
- Children under 19 who are uninsured, 2024: 12.28%
- Starr County, TX
- People under 65 that are uninsured, 2024: 29%
- People under 65 that are uninsured, 2023: 28.91%
- Population per primary care physician: 3,885
- Population per mental health care professional: 4,695
- Children under 19 who are uninsured, 2024: 12.46%
- Ector County, TX
- People under 65 that are uninsured, 2024: 25.26%
- People under 65 that are uninsured, 2023: 22.91%
- Population per primary care physician: 1,751
- Population per mental health care professional: 1,962
- Children under 19 who are uninsured, 2024: 18.56%
- Potter County, TX
- People under 65 that are uninsured, 2024: 24.44%
- People under 65 that are uninsured, 2023: 24.39%
- Population per primary care physician: 1,143
- Population per mental health care professional: 385
- Children under 19 who are uninsured, 2024: 13.36%
- Dallas County, TX
- People under 65 that are uninsured, 2024: 24.15%
- People under 65 that are uninsured, 2023: 22.54%
- Population per primary care physician: 1,387
- Population per mental health care professional: 487
- Children under 19 who are uninsured, 2024: 14.88%
- Harris County, TX
- People under 65 that are uninsured, 2024: 23.76%
- People under 65 that are uninsured, 2023: 22.42%
- Population per primary care physician: 1,717
- Population per mental health care professional: 613
- Children under 19 who are uninsured, 2024: 13.93%
- El Paso County, TX
- People under 65 that are uninsured, 2024: 23.52%
- People under 65 that are uninsured, 2023: 23.03%
- Population per primary care physician: 2,014
- Population per mental health care professional: 810
- Children under 19 who are uninsured, 2024: 10.09%
- Whitfield County, GA
- People under 65 that are uninsured, 2024: 23.43%
- People under 65 that are uninsured, 2023: 24.25%
- Population per primary care physician: 1,870
- Population per mental health care professional: 742
- Children under 19 who are uninsured, 2024: 10.12%
- Liberty County, TX
- People under 65 that are uninsured, 2024: 23.24%
- People under 65 that are uninsured, 2023: 23.20%
- Population per primary care physician: 4,649
- Population per mental health care professional: 3,643
- Children under 19 who are uninsured, 2024: 12.51%
- Bastrop County, TX
- People under 65 that are uninsured, 2024: 22.81%
- People under 65 that are uninsured, 2023: 22.40%
- Population per primary care physician: 4,252
- Population per mental health care professional: 1,455
- Children under 19 who are uninsured, 2024: 14.94%
- Jefferson County, TX
- People under 65 that are uninsured, 2024: 22.68%
- People under 65 that are uninsured, 2023: 23.29%
- Population per primary care physician: 2,097
- Population per mental health care professional: 758
- Children under 19 who are uninsured, 2024: 11.51%
- Angelina County, TX
- People under 65 that are uninsured, 2024: 22.52%
- People under 65 that are uninsured, 2023: 22.30%
- Population per primary care physician: 1,518
- Population per mental health care professional: 593
- Children under 19 who are uninsured, 2024: 13.25%
- Gregg County, TX
- People under 65 that are uninsured, 2024: 22.01%
- People under 65 that are uninsured, 2023: 21.64%
- Population per primary care physician: 1,099
- Population per mental health care professional: 451
- Children under 19 who are uninsured, 2024: 12.65%
- Nacogdoches County, TX
- People under 65 that are uninsured, 2024: 21.99%
- People under 65 that are uninsured, 2023: 22.56%
- Population per primary care physician: 1,406
- Population per mental health care professional: 721
- Children under 19 who are uninsured, 2024: 11.64%
- Henderson County, TX
- People under 65 that are uninsured, 2024: 21.69%
- People under 65 that are uninsured, 2023: 20.98%
- Population per primary care physician: 2,789
- Population per mental health care professional: 1,432
- Children under 19 who are uninsured, 2024: 12.11%
- Smith County, TX
- People under 65 that are uninsured, 2024: 21.18%
- People under 65 that are uninsured, 2023: 21.19%
- Population per primary care physician: 1,014
- Population per mental health care professional: 593
- Children under 19 who are uninsured, 2024: 11.74%
- Nueces County, TX
- People under 65 that are uninsured, 2024: 21.16%
- People under 65 that are uninsured, 2023: 19.61%
- Population per primary care physician: 1,266
- Population per mental health care professional: 648
- Children under 19 who are uninsured, 2024: 9.83%
- Wise County, TX
- People under 65 that are uninsured, 2024: 20.88%
- People under 65 that are uninsured, 2023: 21.38%
- Population per primary care physician: 2,656
- Population per mental health care professional: 1,702
- Children under 19 who are uninsured, 2024: 12.98%
Top 20 Counties With the Lowest Rates of Uninsured People
Counties are ranked based on the rate of the total population under age 65 that did not have health insurance in 2024.
- Norfolk County, MA
- People under 65 that are uninsured, 2024: 2.39%
- People under 65 that are uninsured, 2023: 2.28%
- Population per primary care physician: 836
- Population per mental health care professional: 145
- Children under 19 who are uninsured, 2024: 0.86%
- Middlesex County, MA
- People under 65 that are uninsured, 2024: 2.41%
- People under 65 that are uninsured, 2023: 2.90%
- Population per primary care physician: 803
- Population per mental health care professional: 145
- Children under 19 who are uninsured, 2024: 1.06%
- Hampshire County, MA
- People under 65 that are uninsured, 2024: 2.48%
- People under 65 that are uninsured, 2023: 2.79%
- Population per primary care physician: 781
- Population per mental health care professional: 93
- Children under 19 who are uninsured, 2024: 1.02%
- Plymouth County, MA
- People under 65 that are uninsured, 2024: 2.69%
- People under 65 that are uninsured, 2023: 2.82%
- Population per primary care physician: 1,577
- Population per mental health care professional: 161
- Children under 19 who are uninsured, 2024: 1.12%
- Franklin County, MA
- People under 65 that are uninsured, 2024: 2.80%
- People under 65 that are uninsured, 2023: 3.15%
- Population per primary care physician: 1,578
- Population per mental health care professional: 106
- Children under 19 who are uninsured, 2024: 1.17%
- Worcester County, MA
- People under 65 that are uninsured, 2024: 3.01%
- People under 65 that are uninsured, 2023: 2.79%
- Population per primary care physician: 1,071
- Population per mental health care professional: 172
- Children under 19 who are uninsured, 2024: 1.14%
- Carver County, MN
- People under 65 that are uninsured, 2024: 3.08%
- People under 65 that are uninsured, 2023: 3.55%
- Population per primary care physician: 1,181
- Population per mental health care professional: 453
- Children under 19 who are uninsured, 2024: 2.22%
- Berkshire County, MA
- People under 65 that are uninsured, 2024: 3.11%
- People under 65 that are uninsured, 2023: 3.26%
- Population per primary care physician: 912
- Population per mental health care professional: 103
- Children under 19 who are uninsured, 2024: 1.24%
- Essex County, MA
- People under 65 that are uninsured, 2024: 3.15%
- People under 65 that are uninsured, 2023: 3.58%
- Population per primary care physician: 1,350
- Population per mental health care professional: 152
- Children under 19 who are uninsured, 2024: 1.23%
- Barnstable County, MA
- People under 65 that are uninsured, 2024: 3.17%
- People under 65 that are uninsured, 2023: 3.34%
- Population per primary care physician: 1,112
- Population per mental health care professional: 190
- Children under 19 who are uninsured, 2024: 1.25%
- Suffolk County, MA
- People under 65 that are uninsured, 2024: 3.27%
- People under 65 that are uninsured, 2023: 3.77%
- Population per primary care physician: 635
- Population per mental health care professional: 94
- Children under 19 who are uninsured, 2024: 1.08%
- Washington County, MN
- People under 65 that are uninsured, 2024: 3.40%
- People under 65 that are uninsured, 2023: 4.21%
- Population per primary care physician: 959
- Population per mental health care professional: 312
- Children under 19 who are uninsured, 2024: 2.23%
- Bristol County, MA
- People under 65 that are uninsured, 2024: 3.51%
- People under 65 that are uninsured, 2023: 3.77%
- Population per primary care physician: 1,980
- Population per mental health care professional: 174
- Children under 19 who are uninsured, 2024: 1.33%
- Newport County, RI
- People under 65 that are uninsured, 2024: 3.70%
- People under 65 that are uninsured, 2023: 3.81%
- Population per primary care physician: 1,201
- Population per mental health care professional: 259
- Children under 19 who are uninsured, 2024: 2.24%
- Hampden County, MA
- People under 65 that are uninsured, 2024: 3.71%
- People under 65 that are uninsured, 2023: 3.86%
- Population per primary care physician: 1,502
- Population per mental health care professional: 90
- Children under 19 who are uninsured, 2024: 1.38%
- Washington County, RI
- People under 65 that are uninsured, 2024: 3.72%
- People under 65 that are uninsured, 2023: 3.08%
- Population per primary care physician: 1,220
- Population per mental health care professional: 280
- Children under 19 who are uninsured, 2024: 2.23%
- Oldham County, KY
- People under 65 that are uninsured, 2024: 3.74%
- People under 65 that are uninsured, 2023: 4.44%
- Population per primary care physician: 1,675
- Population per mental health care professional: 837
- Children under 19 who are uninsured, 2024: 2.74%
- Placer County, CA
- People under 65 that are uninsured, 2024: 3.86%
- People under 65 that are uninsured, 2023: 4.49%
- Population per primary care physician: 820
- Population per mental health care professional: 265
- Children under 19 who are uninsured, 2024: 2.12%
- Kent County, RI
- People under 65 that are uninsured, 2024: 3.97%
- People under 65 that are uninsured, 2023: 3.31%
- Population per primary care physician: 1,186
- Population per mental health care professional: 250
- Children under 19 who are uninsured, 2024: 2.05%
- Chittenden County, VT
- People under 65 that are uninsured, 2024: 3.98%
- People under 65 that are uninsured, 2023: 4.35%
- Population per primary care physician: 572
- Population per mental health care professional: 132
- Children under 19 who are uninsured, 2024: 1.41%
Data and Methodology
Data for this SmartAsset study is for 2024 and comes from County Health Rankings & Roadmaps. Data was examined for the largest 810 counties for which data was available.
This story was produced by SmartAsset and reviewed and distributed by Stacker.


 Sign Up

